import numpy as np
filepath = '/kaggle/input/c2piano/C2.wav'Let’s discover some ways in which we can manipulate sound using a Python and a couple awesome open source projects.
Loading A Sound
import IPython
IPython.display.Audio(filepath)Generating Sound
import librosa
import soundfile as sf

y, sr = librosa.load(filepath, sr=16000) # y is a numpy array of the wav file, sr = sample rate
y_shifted = librosa.effects.pitch_shift(y, sr, n_steps=2) # shifted by 4 half steps
sf.write('shifted.wav', y_shifted, sr, subtype='PCM_24') # write to shifted.wav using soundfile
shifted_path = '/kaggle/working/shifted.wav'
IPython.display.Audio(shifted_path)
/opt/conda/lib/python3.7/site-packages/ipykernel_launcher.py:5: FutureWarning: Pass sr=16000 as keyword args. From version 0.10 passing these as positional arguments will result in an error
"""Visualizing Sound
import librosa.display # https://librosa.org/doc/main/troubleshooting.html

librosa.display.waveshow(y, sr=sr)
<librosa.display.AdaptiveWaveplot at 0x7faed03dce90>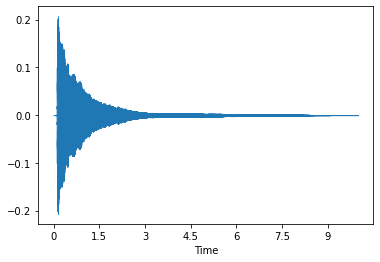
import matplotlib.pyplot as plt

# https://librosa.org/doc/main/generated/librosa.display.specshow.html#librosa.display.specshow
y, sr = librosa.load(filepath, duration=15)
fig, ax = plt.subplots(nrows=2, ncols=1, sharex=True)
D = librosa.amplitude_to_db(np.abs(librosa.stft(y)), ref=np.max)
img = librosa.display.specshow(D, y_axis='linear', x_axis='time',
                               sr=sr, ax=ax[0])
ax[0].set(title='Linear-frequency power spectrogram')
ax[0].label_outer()
hop_length = 1024
D = librosa.amplitude_to_db(np.abs(librosa.stft(y, hop_length=hop_length)),
                            ref=np.max)
librosa.display.specshow(D, y_axis='log', sr=sr, hop_length=hop_length,
                         x_axis='time', ax=ax[1])
ax[1].set(title='Log-frequency power spectrogram')
ax[1].label_outer()
fig.colorbar(img, ax=ax, format="%+2.f dB")
<matplotlib.colorbar.Colorbar at 0x7faed02e0110>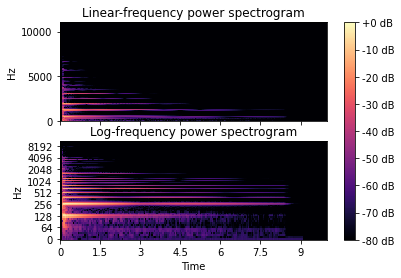
🎶🎹 This Python notebook can be copied in my equivalent Kaggle post 🎶🎹